
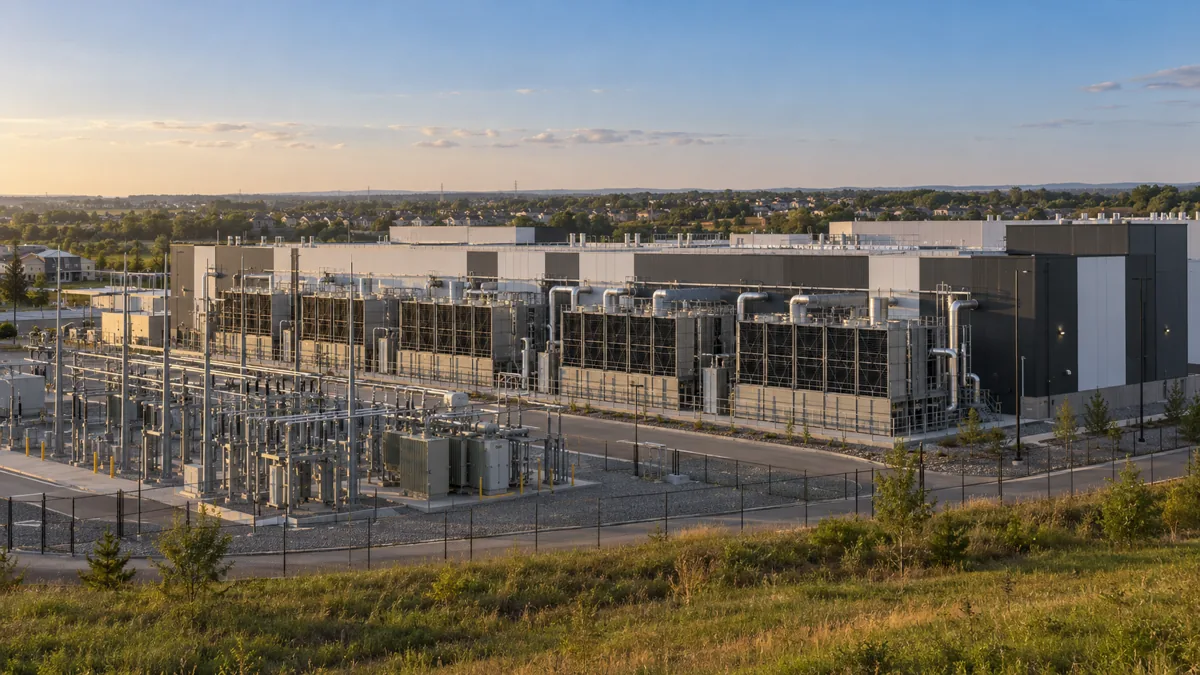
The AI answer on your screen has a physical address somewhere. Behind it are chips, electrical connections, cooling equipment and a building that may operate around the clock. That is where the environmental questions become real: who supplies the power, where the cooling water comes from, and what happens at the homes beyond the fence.
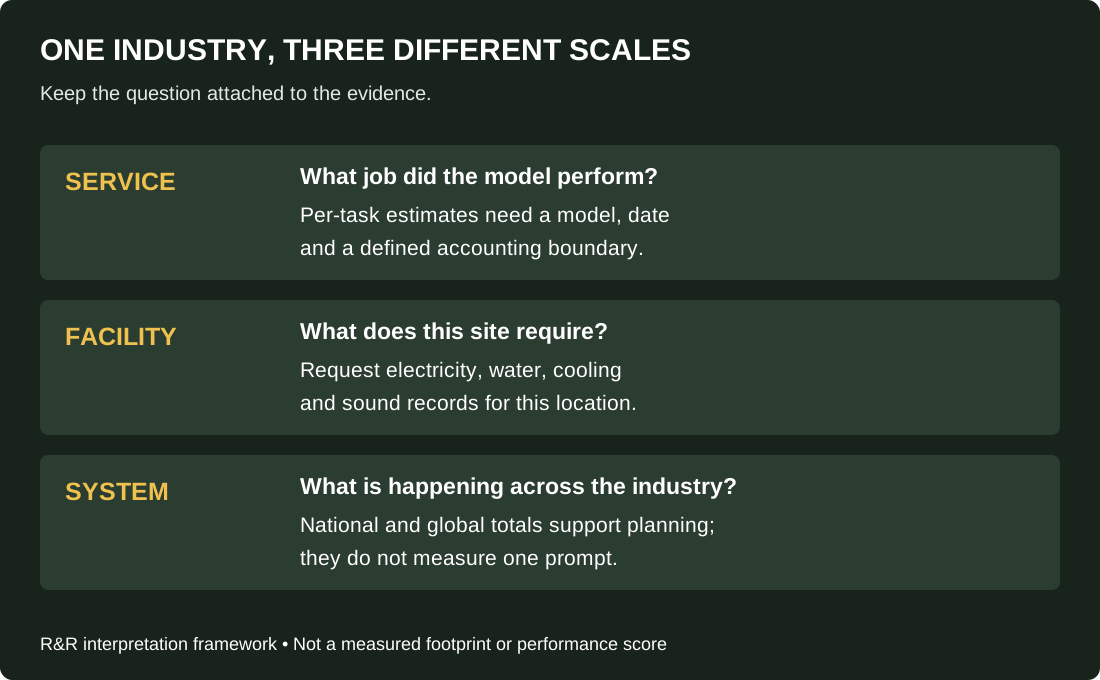
Our assessment is straightforward. AI's environmental impact deserves scrutiny, but useful scrutiny needs the right boundaries. A national data-center forecast does not measure your chatbot session. An efficient prompt does not establish that a new campus is harmless. And a renewable-energy claim does not, by itself, answer a neighbor's question about an overnight hum.
This explainer brings those scales together. We distinguish published estimates from forecasts, show the assumptions behind simple calculations, and offer a document-based way to examine local proposals. The purpose is to make the evidence usable, whether you are choosing a digital service or wondering what a nearby development will mean for your household.
What is AI's environmental impact?
AI's environmental footprint includes electricity for computing and supporting infrastructure, water associated with cooling and power generation, and the materials and manufacturing behind equipment. A particular site can also raise local concerns about sound, backup generation and utility infrastructure. Those categories overlap, but they are not interchangeable measurements.
The U.S. Government Accountability Office's assessment identifies substantial energy and water demands while emphasizing gaps in company disclosure. Crucially, it says the portion of data-center electricity attributable to generative AI remains unclear. That is why we do not label every data-center kilowatt-hour an AI kilowatt-hour.
For readers, the useful starting question is **which impact, at which scale?** A household choosing an app needs information about the service and workload. A town deciding whether to approve a campus needs information about that site, utility system and watershed. One headline cannot settle both decisions.
The 2026 numbers and what they actually measure
Two recent primary publications provide a stronger starting point than an undated viral statistic. The IEA's April 16, 2026 update estimates that global data-center electricity demand increased 17% in 2025, compared with 3% growth in total global electricity demand. It projects data-center electricity consumption doubling by 2030 and AI-focused consumption tripling.
Separately, Berkeley Lab's June 2026 publication, titled the *2025 Update*, models U.S. data-center electricity at 649 terawatt-hours in 2030 in its reference case. Its compounded uncertainty bounds are 521–843 TWh, corresponding to 9.5–15.3% of total U.S. electricity; the reference share is 11.8%.
These are forecasts for all data centers, not observed 2030 results or an AI-only total. The chart below deliberately keeps the U.S. forecast separate from the global growth comparison. Combining them into one trend line would hide a change of geography, denominator and measurement type.
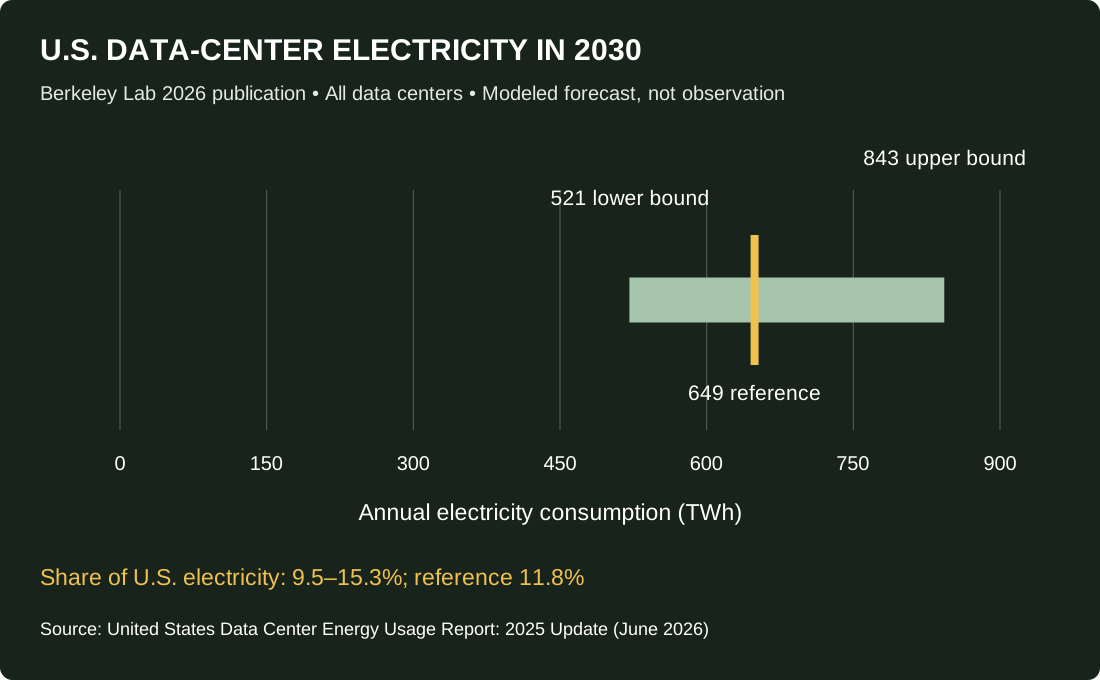
A forecast range is useful precisely because the future is unsettled. It gives planners alternatives to examine rather than a single number to repeat as destiny. When evaluating a project, ask which demand case its utility plan uses and what happens if construction, equipment deployment or utilization differs from the plan.
Why AI uses electricity beyond the chips
A server performs computation, but a facility must also keep equipment operating within its design conditions. Looking only at an accelerator's active power leaves out the rest of the system. The Department of Energy's data-center design guide addresses IT equipment, air management, cooling, electrical systems and heat recovery as connected design questions.
A useful accounting distinction is between **power** and **energy**. Power is the rate of use, measured in watts or megawatts. Energy adds time, measured in watt-hours or megawatt-hours. A proposed 100-megawatt connection is not a statement that the facility will consume 100 megawatt-hours in a year, and a permitted connection does not establish actual operating demand.
Here is a transparent arithmetic example, not a measured facility. A hypothetical site drawing an average 100 MW continuously for a 365-day year would use 876,000 MWh, or 0.876 TWh: 100 × 24 × 365. If that average were 50 MW, the result would be half as large. The assumptions do the work.
That is why a project description should distinguish connection capacity, expected average draw, annual energy and the timing of its highest demand. Ask for the unit before reacting to the number. Otherwise, a discussion can move between capacity and consumption without anyone noticing that the claim has changed.
Does one AI prompt really use a bottle of water?
There is no universal bottle-per-prompt conversion that accurately describes every model, location and task. A useful estimate must say what was measured, which resources were included, and whether the figure represents a median, mean or particular scenario.
One concrete example is Google's August 2025 disclosure. It estimated a median Gemini Apps text prompt at 0.24 Wh and 0.26 milliliters of water using May 2025 activity and fleet-average factors. Google states that these figures are not representative of every prompt or future performance and were not independently verified by a third party.
That makes the disclosure a bounded company estimate, not a universal answer for AI. It does not justify assigning the same footprint to another provider, an image-generation task, or a multistep agent. Likewise, a much larger estimate drawn from another system should not automatically be applied to this one.
When someone offers a single dramatic comparison, look for five missing labels: task, model, date, infrastructure boundary and location. If those labels are absent, treat the comparison as incomplete. You can acknowledge that a footprint exists without pretending to know its exact size.
Why does AI use water?
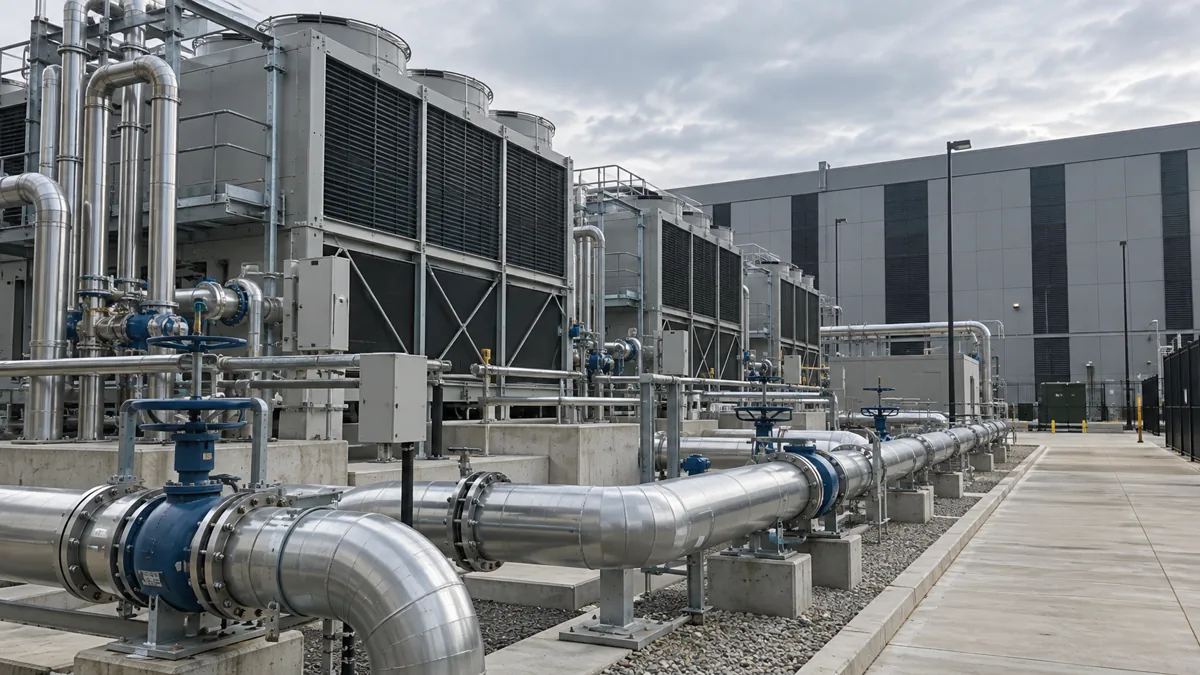
The practical explanation starts with heat management. Water can help move heat away from equipment, and evaporative cooling transfers heat into the surrounding air. The Department of Energy's cooling-tower guidance explains that a tower loses water through evaporation, drift and blowdown; make-up water replaces those losses. Blowdown controls the concentration of dissolved solids.
That explanation matters because the water circulating inside equipment is not automatically the same quantity as water newly supplied to the site. A recirculating system can still require make-up water. Conversely, a large volume moving through a system should not automatically be described as permanently consumed.
For a local proposal, request a water balance rather than a slogan. The useful document identifies supply, circulation, discharge and consumption with units and time periods. It should also identify which values are design assumptions and which are measured operating figures. A statement about an efficient cooling component does not answer every question about the facility around it.
Water withdrawal, consumption and drought are different questions
The USGS National Water Availability Assessment Data Companion distinguishes withdrawals from consumptive use. Withdrawals describe water diverted for use; consumptive use describes the portion not returned, such as water evaporated or incorporated into products. The resource also provides modeled watershed-scale information, rather than a promise about a particular facility's future supply.
For a resident, the distinction changes what to ask. Where is the source? Is the supply potable, reclaimed or another authorized source? What returns to the system? What is the expected demand during a hot, dry period? An annual total can be informative while still leaving those questions open.
We would examine a water claim in three columns: **amount, timing and place**. The amount identifies the volume. Timing reveals whether the largest demand coincides with local stress. Place identifies the actual supply system or watershed. A company-wide improvement belongs in a separate column until its relevance to the proposed site is explained.
Our home heatwave guide addresses household preparation for extreme heat. Keep that practical planning separate from assertions that a specific data center will cause a local shortage; such a claim requires local evidence, not simply a global AI trend.
Electricity use and carbon emissions are not the same figure
A kilowatt-hour measures energy, not carbon. To estimate emissions associated with electricity, an analysis needs an emissions factor and a clear accounting method. EPA's eGRID documentation describes plant and regional emissions data, including rates expressed per megawatt-hour. Its geographic groupings matter when interpreting electricity-related estimates.
Consider another deliberately simplified example. At an assumed factor of 400 grams of CO2-equivalent per kWh, 10 kWh corresponds to 4,000 grams, or 4 kg. At an assumed 50 g/kWh, the same 10 kWh corresponds to 0.5 kg. These are hypothetical factors illustrating the calculation, not measured footprints for any AI provider.
The comparison shows why a claim about lower electricity use and a claim about lower emissions need separate evidence. It also shows why the emissions factor, year and geography belong next to the result. Without them, a precise-looking carbon number can conceal a very broad assumption.
For household context, EPA's Power Profiler is a starting point for regional electricity information. It is not a way to locate the remote server that handled your prompt, and it cannot by itself establish that service's emissions. Use each tool for the question it can actually answer.
| Claim you encounter | What to request | What it does not establish |
|---|---|---|
| Lower energy per task | Task, model, date and system boundary | Lower total annual demand |
| Less water used | Withdrawal or consumption, source, location and period | No local supply impact |
| Cleaner electricity | Emissions method, geography, year and contract scope | No neighborhood noise |
| A quiet facility | Study, operating conditions and applicable measurement rules | Compliance everywhere or under every condition |
| New infrastructure benefits everyone | Relevant utility filing and approval conditions | A guaranteed reduction in household bills |
What about the equipment before it reaches the building?
An operating footprint and a life-cycle footprint answer different questions. The former examines use; the latter also asks what belongs before and after that use. If an assessment omits equipment production or disposal, the reader should be able to see that boundary immediately.
GAO calls for better disclosure of the environmental effects of building and disposing of equipment, alongside energy, emissions and water information. That supports asking for a fuller account; it does not support inventing a universal manufacturing share for every AI service. Public evidence is too incomplete for that shortcut.
Our practical reading rule is to avoid upgrading a narrow claim into a broad one. “Lower operational emissions” does not mean “no environmental impact.” “Newer equipment” does not establish a lower total footprint without knowing what was replaced, what service it provides and how the comparison was made.
For a procurement decision, request the comparison's functional unit: one completed task, a year of service, or another stated output. Comparing two systems without an equivalent job can reward the one that simply does less. A credible assessment makes the service being compared visible alongside the resources consumed.
Data-center noise is a local issue that global averages miss
A site's electrical efficiency cannot tell you what a nearby bedroom sounds like at night. Loudoun County's guidance identifies cooling equipment, mechanical systems and backup generators among data-center sound sources. It also explains why tonal and low-frequency sound can require attention beyond a single A-weighted decibel reading.
The distinction is useful without turning every hum into a medical claim. We have not measured any neighborhood's exposure. A recording on social media may help describe a concern, but it does not establish the source, compliance status or health effect of that sound.
A useful complaint record identifies date, time, location, duration and the conditions in which the sound is noticeable. Keep the description concrete: a continuous hum, an intermittent mechanical sound, or a change associated with a particular time. Ask the relevant authority how it investigates the source and what measurement method applies.
Loudoun requires pre-construction and post-construction noise studies under its zoning framework. That is a local example, not a nationwide rule. Readers elsewhere should request the applicable requirements rather than assume another county's limit or procedure governs their property.
Could AI data centers raise your electricity bill?
There is no responsible national yes-or-no answer for an individual bill. The IEA's 2026 analysis identifies large, concentrated demand and rapid expansion as affordability challenges, while noting that policy and infrastructure choices can manage them. Increased demand does not mechanically determine a particular household's rate.
The more useful question is **who bears which costs under the local arrangement?** Request the utility filing or rate proposal that addresses the development. Look for connection costs, infrastructure commitments, expected demand and provisions for a project that is delayed, reduced or abandoned. A promised benefit is easier to evaluate when the underlying obligation is visible.
Here is an original document-reading approach. Put each major claim beside the instrument that would make it accountable. A claim about paying for infrastructure should point to a tariff, agreement or approved filing. A claim about reliable service should identify the relevant planning assessment. A claim about household savings should show its calculation and assumptions.
That approach does not presume a project is good or bad. It prevents a press release from standing in for the documents needed to judge it. Our apartment power-outage guide covers household continuity planning; it should not be read as evidence that a nearby AI facility will cause outages.
Can cleaner energy and better cooling solve the problem?
They can address parts of the footprint, but the result must be evaluated across more than one measure. A 2026 review in Nature Reviews Clean Technology describes trade-offs among energy, water and emissions, including the possibility that reducing water consumption can increase carbon emissions. A single improvement is not automatically a complete environmental assessment.
The practical response is to ask for a balanced comparison. If water demand falls, what happens to electricity? If annual emissions fall, what happens at the local site? If an efficiency measure lowers resources per task, how has total activity changed? These are complementary questions rather than reasons to dismiss improvement.
Be equally careful with future technology. A planned supply agreement is not the same thing as an operating generator. A proposed cooling system is not a year of measured performance. Ask what exists today, what is contracted, what still requires approval and what happens if the schedule slips.
For readers, the important habit is to keep tense visible. “Uses,” “has contracted,” “plans” and “could” describe different states of evidence. Substituting one for another makes an article sound more certain while making it less informative.
Our practical framework for evaluating a nearby project
Start with the decision you are actually trying to make. A planning hearing, a utility-rate proceeding and a noise complaint are different processes. Sending the same broad objection to all three may overlook the document or remedy relevant to each one.
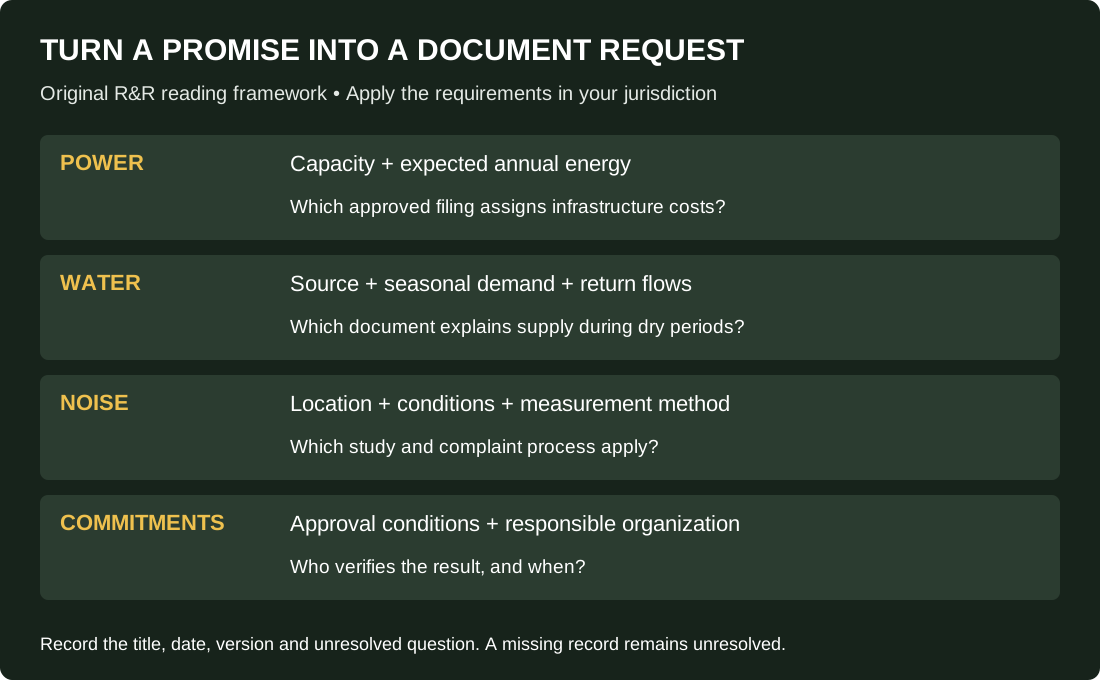
Our framework is to build a short evidence file with five entries: the claim, the document supporting it, the date, the responsible organization and the unresolved question. A row with a missing document remains unresolved. It should not silently become either an accusation or an assurance.
For electricity, request both capacity and expected consumption. For water, request source and seasonal demand. For noise, request the assessment location and operating conditions. For backup generation, request the applicable permit and testing information. For community commitments, request the actual conditions attached to approval.
Keep versions. A revised site plan may change equipment placement or operating assumptions. A useful public discussion needs to know which version a measurement or promise refers to. Save the date and document title rather than relying on an isolated screenshot whose context may be lost.
Finally, distinguish answers from referrals. “Ask the operator” is not an answer from a planning authority about its approval conditions. “The project will comply” is not a sound study. A clear next step names the record or office that can resolve the specific question.
What you can do without buying anything
For everyday AI use, choose a tool that fits the job and avoid unnecessary repeated generation. That is a practical resource-conscious habit, not a quantified promise about a particular amount of water saved. Without a service-specific measurement, we will not attach a dramatic number to it.
For local concerns, obtain the project documents before buying monitoring equipment. A consumer meter in your home cannot measure a remote data center's electricity, and a basic sound reading cannot settle every tonal-noise question. Good records and the correct authority are often a better first step than a purchase.
For preparedness, keep reliable access to essential information if electricity or connectivity fails. Our family AI risk and safety guide covers practical digital safeguards, while the resources page provides downloadable planning material. Those are continuity measures, not remedies for industrial environmental impacts.
We have deliberately left shopping recommendations out of this explainer. No household product resolves the accounting and planning questions above. The useful action is to improve the evidence behind decisions, then match any purchase to a separate, demonstrated household need.
Questions readers ask about AI and the environment
Is all data-center electricity used for AI?
No. A figure describing all data centers should retain that label. It cannot be reassigned to generative AI without evidence separating workloads. This article labels the scope of its electricity figures rather than treating the categories as synonyms.
Is AI water use the same everywhere?
A universal per-prompt number would need assumptions that do not hold across every service and location. Request the system boundary, cooling context, task and period. An estimate can be useful within those limits without becoming an industry-wide constant.
Does a renewable-energy claim answer the noise question?
No. Electricity sourcing and local sound are different subjects. Evaluate each with the relevant records. A strong answer to one environmental question does not remove the need to answer the others.
Should I stop using AI altogether?
That is a personal decision, but it should be informed by the task's value and the evidence available. Avoid treating either a frightening universal comparison or a reassuring company average as a complete account. Ask what is being measured before deciding what the number means.
How we researched this explainer
Ready & Resourceful reviewed primary public material available on October 16, 2026, including IEA, Berkeley Lab, GAO, DOE, EPA, USGS, a peer-reviewed review and Loudoun County guidance. Company figures are identified as company estimates. The two arithmetic examples are explicitly hypothetical; our graphics do not claim original field measurements.
Our contribution is the comparison framework: keeping scale, unit, geography, date and evidence type attached to environmental claims, then connecting each claim to a practical document request. We have not conducted facility inspections, noise testing, utility-rate modeling or a life-cycle assessment. The opening and cooling scenes depict generic infrastructure rather than a named facility.
The CNN link supplied as the starting reference was inaccessible during research, so this is an independently developed explainer, not a line-by-line assessment of its reporting. If a primary source revises its figures, the corresponding chart and explanation should be reviewed together. Clear corrections and visible boundaries are part of authority, not obstacles to it.