
Hurricane Isaias has left a substantial interruption to Gulf offshore energy production, even as shutdown estimates ease. By October 11, an estimated 57.54% of daily Gulf oil production remained shut in, down from 71.51% on October 9. The immediate question for American households is how that recovery translates into usable fuel, functioning deliveries and access to stations.
The distinction matters. An offshore well, a refinery and a neighborhood gas station do different jobs. A shutdown at one does not establish a shutdown at all three. I would watch the recovery of each link before treating a dramatic production percentage as a prediction for the price on your next receipt.
This is a developing energy story with practical consequences for hurricane recovery. The latest federal snapshot reviewed here is dated October 11. It shows improving offshore conditions, not a verified return to normal across the fuel system. For families managing outages, the useful response is a workable transport and household plan rather than a speculative rush to buy gasoline.
Gulf oil shutdowns declined but remained substantial
The Marine Minerals Administration's October 11 update estimated 1,173,863 barrels per day of Gulf oil production was shut in. That represented 57.54% of the region's expected daily production. Natural gas shut-ins totaled 1.051 billion cubic feet per day, or 49.11%. The figures came from operator submissions as of 11 a.m. CDT, not from measurements of retail fuel shortages.
On October 9, the estimated oil shut-in total was 1,458,814 barrels per day, or 71.51%. The two snapshots imply a decline of 284,951 barrels per day in the estimated interrupted total and a reduction of 13.97 percentage points in the oil share. Those calculations describe the change between published estimates; they do not independently measure deliveries restored to consumers.
| Official snapshot | Estimated oil shut in | Share of Gulf daily oil production | Companies reporting |
|---|---|---|---|
| October 9 at 11 a.m. CDT | 1,458,814 barrels per day | 71.51% | 12 |
| October 11 at 11 a.m. CDT | 1,173,863 barrels per day | 57.54% | 31 |
The reporting pool changed, so I would read this as an encouraging direction across two operational snapshots, not a perfectly matched comparison of identical facilities. The denominator is Gulf production. Neither percentage means that the United States lost the same share of its total oil supply or refinery capacity.
Sources for the comparison are the October 9 federal offshore update and the October 11 update. Keeping those dates attached to the numbers prevents a recovery story from becoming a recycled pre-storm warning.
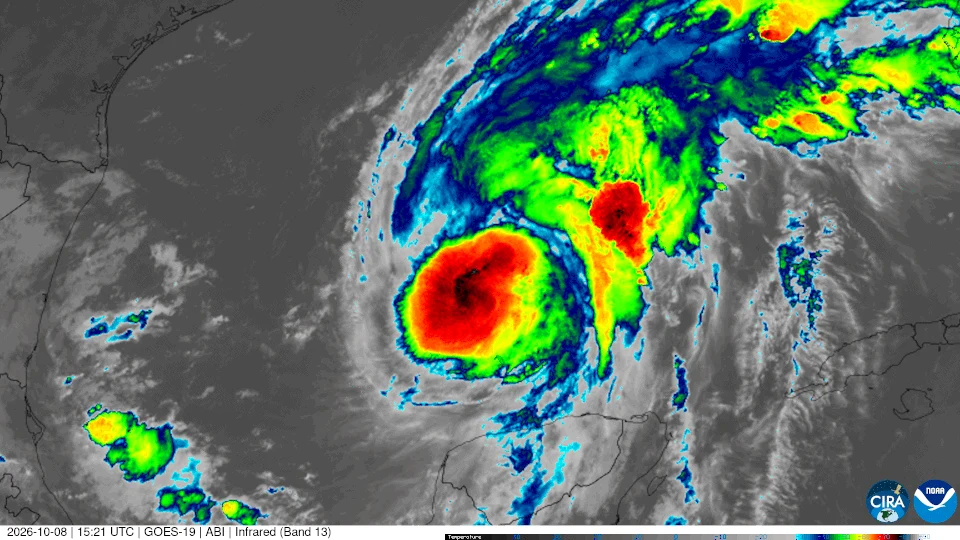
Shell reports no damage at five offshore assets
One concrete sign of recovery came from Shell's October 10 storm update. The company said its Mars, Olympus, Ursa, Vito and Appomattox assets had no storm damage, and that personnel redeployment was continuing as offshore conditions improved. That is a company-specific operational statement, not an inspection result for every Gulf facility.
It also stops short of confirming full production restoration at all five assets. Redeploying workers is a step toward normal operations; the statement does not supply a completed restart timetable or a barrel-by-barrel recovery total. I would not turn a reassuring damage assessment into a claim that the interruption is over.
This distinction gives readers a practical way to evaluate subsequent updates. Look for the named facility, the date, the actual operational status and the next dependency. A statement about personnel returning answers a different question from one confirming sustained production. Shell's original update provides the narrower, useful fact.
Why offshore oil losses are not refinery shutdown totals
Crude oil production is the upstream part of the system. Refineries process crude into products including gasoline, diesel and jet fuel. Transport and distribution then move those products toward customers. EIA's petroleum explanation describes that basic chain. A large interruption upstream is important, but it cannot be substituted for a verified tally of refinery outages.
I think that is the easiest mistake to make when scanning hurricane coverage. The word “oil” appears in production figures, refinery discussions and pump-price stories, even though the measurements refer to different stages. Reading the unit is a useful safeguard: barrels of crude production per day are not gallons of gasoline unavailable at a local station.
The same caution applies to precautionary shutdowns. A facility can pause operations to protect workers without being destroyed. Conversely, improving offshore conditions do not inspect a refinery's electrical equipment or reopen a damaged road. Each status needs its own evidence. The available figures establish a significant offshore interruption; they do not establish a coastwide refining collapse.
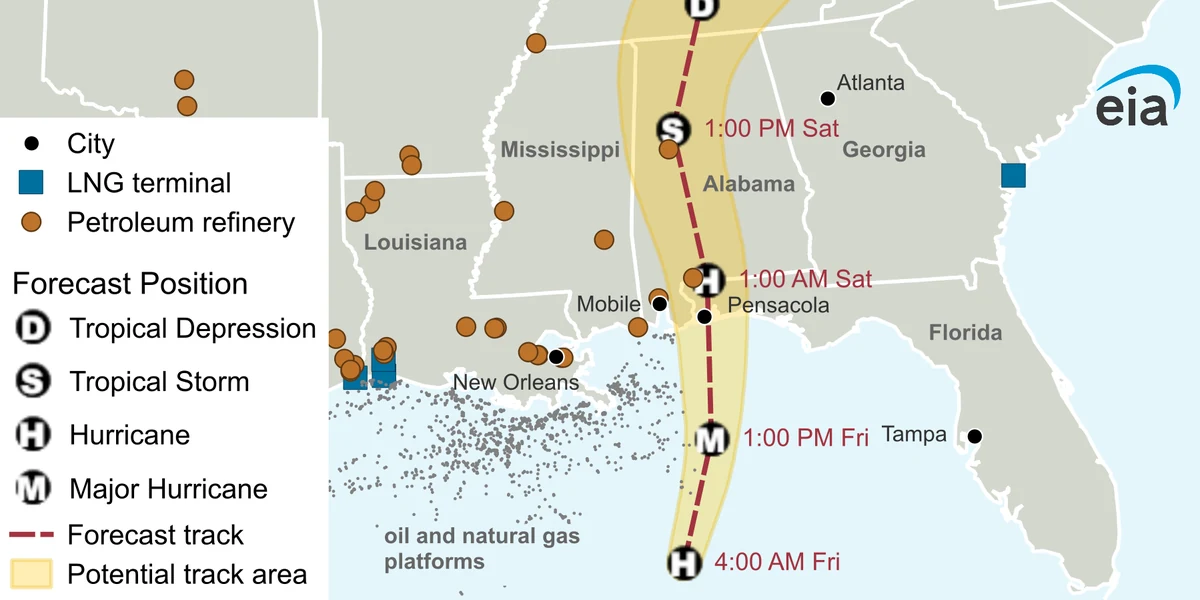
The Gulf Coast remains a major refining region
EIA's January 1, 2026 capacity data list 58 operable refineries in the Gulf Coast petroleum district, with calendar-day crude distillation capacity of 9,876,563 barrels per day. Rounded, that is 9.88 million barrels daily. It is a regional capacity baseline, not a measurement of what those plants processed during Isaias.
That baseline explains why a Gulf hurricane belongs in a national energy story. It also sets a limit on what a map can tell us. A refinery marker shows where infrastructure is located. It does not identify equipment damage, operating rates, available inventories or when a specific plant will restart.
The underlying EIA capacity table distinguishes calendar-day capacity from stream-day capacity. I use the calendar-day figure consistently here. Mixing those measures, or treating every refinery within a broad regional district as directly hit, would exaggerate the scale of a confirmed outage.
For readers, the useful follow-up is facility-level recovery information. A national capacity total can explain exposure, but decisions about an evacuation route or a local fuel stop need current regional information. Those are complementary questions, not interchangeable measurements.
Fuel inventories were already below seasonal averages
Before Isaias, the fuel system had an uneven inventory cushion. For the week ending October 2, EIA put total gasoline inventories 6% below their five-year average and distillate inventories 12% below their five-year average. Distillates include diesel-related supply. Those comparisons help explain concern about an additional interruption without establishing that products have run out.
The same weekly summary put U.S. refinery utilization at 92.7%, with crude inputs averaging 16.5 million barrels per day. These are pre-storm national figures. They should not be presented as post-landfall operating rates or as a current utilization reading for Gulf refineries alone.
I would separate that verified baseline from older commentary about how close the system was to its limit. A lower-than-average inventory level is a vulnerability indicator; it is not a timetable for empty pumps. The next useful evidence is how production, inventories and distribution change after the disruption.
The EIA weekly summary is a rolling publication, so check its reporting week when reading it. EIA's weekly report page lists the next release for October 15 because of the federal holiday. That next observation should help distinguish pre-storm conditions from the subsequent recovery period.
Why the earlier refinery warning needs a recovery update
CNN's October 8 analysis of hurricane and refinery risks examined the danger before landfall, including the possibility of disrupted refining alongside pressures elsewhere in global energy markets. It framed a potential interruption, not a completed accounting of storm damage.
That earlier warning remains useful context. It explains why the storm attracted attention beyond the immediate evacuation area. But on October 12, I would lead with dated operational evidence rather than repeat an earlier exposure estimate as though every threatened facility had subsequently shut down.
For readers in Europe and other Western markets, the same principle applies. A U.S. hurricane can be part of a broader energy discussion, but a Gulf production percentage alone does not establish an identical price movement abroad. Regional inventories, trading conditions and distribution need their own evidence. This article does not assign a specific overseas price increase to Isaias.
Local fuel access can matter more than a national price
An energy headline can be large while a household's immediate problem is small and specific: one usable route, one operating station, or enough transport flexibility to reach an essential appointment. That is why I would separate a national price discussion from a local access plan.
EIA's hurricane-risk explanation, published in May 2025, identifies refinery outages and fuel logistics as separate concerns. It also notes Florida's reliance on barges carrying products from Gulf Coast refineries. The practical implication is to examine delivery routes as well as production, rather than assume that improving offshore figures resolve every downstream issue.
For a household affected by the storm, make the next journey specific. Identify its purpose, destination, route and a backup contact. Confirm conditions through current local notices before setting out. I would prioritize necessary travel over chasing an unverified report of cheaper gasoline in another neighborhood.
Our Isaias flooding and power-outage coverage addresses the wider recovery setting. The fuel story belongs alongside that coverage, because transport decisions should account for the condition of the route, not just whether a station appears on a map.
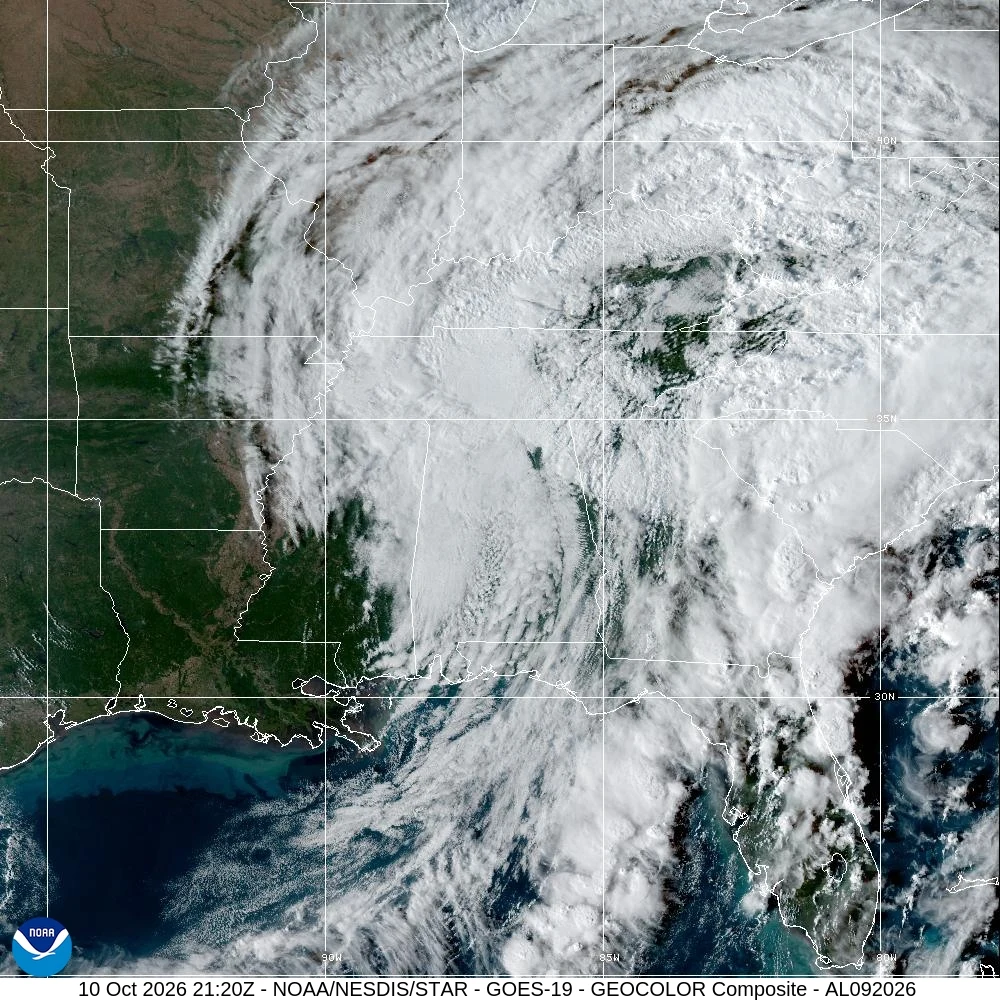
A household recovery plan should include more than gasoline
A fuel concern can distract from the basics that make staying home workable. I would begin with the household tasks that must continue: drinking water, food, lighting, communication, medication access and bathroom use. Then identify which tasks depend on power, travel or a working water supply.
Write the plan around people rather than a shopping category. Who needs to travel? Who can check on someone living alone? Where are the instructions and supplies if a phone battery runs down? These questions produce a clearer response than a long list of products with no retrieval or transport plan.
The free 72-hour emergency kit checklist offers a starting inventory without product links. Use it to mark what you already have and what is genuinely missing. Our 72-hour preparedness guide adds planning context and disclosed product comparisons; buying every suggested item is not a condition of using the checklist.
Bathroom arrangements deserve their own decision. If power or water is interrupted, consult whether your toilet can flush during a power outage before assuming stored water solves the problem. A fuel plan that ignores sanitation leaves an important household dependency unresolved.
Generator safety belongs in the fuel discussion
Anyone relying on a fuel-powered generator needs a safe operating arrangement, not only a supply of gasoline. CDC warns that generators can cause fatal carbon monoxide exposure. They must operate outside, more than 20 feet from windows, doors and vents, and never inside a home or garage, even with openings left open.
CDC also recommends battery-powered or battery-backup carbon monoxide detectors when using a generator. Its carbon monoxide guidance is the safety reference here. A generator's ability to power equipment does not make an unsuitable operating location acceptable.
I would put placement and monitoring on the same written plan as fuel needs. If the property cannot accommodate a safe setup, that is a planning constraint to resolve rather than work around informally. The purpose of backup power is to protect the household through an interruption, not introduce another emergency.
This article does not calculate a universal fuel reserve. Equipment demand and operating instructions differ. Work from the actual generator manual and the household's essential loads, rather than borrowing a consumption figure from an unrelated model or a dramatic social-media post.
What to watch as the energy recovery develops
The next update should answer several distinct questions. Are offshore shut-in estimates continuing to fall? Are named refineries operating, restarting or awaiting repairs? What do post-storm product inventories show? What do local officials and suppliers say about access in affected communities? No single percentage answers all four.
I would track dates and units alongside each answer. A capacity figure describes potential processing, an operating update describes a facility's status, and an inventory figure describes stored supply. A station notice concerns a local service. Keeping those categories separate makes the news easier to act on and harder to misread.
The recovery evidence is encouraging but incomplete. Estimated offshore oil shut-ins declined between October 9 and October 11, and Shell reported no damage at five named assets. Neither fact confirms normal conditions across every refinery, delivery route or neighborhood station. The sensible response is to keep essential travel and household needs covered while watching for verified operational updates.
For my reading of this story, the priority is straightforward: replace broad alarm with specific dependencies. Know what your household needs, know which services support it, and use dated official information to decide what changes. That remains useful whether the next energy update shows faster restoration or a longer interruption.
Sources and reporting scope
Ready & Resourceful prepared this news analysis from the linked federal data, operator statement and CNN reference, reviewed on October 12, 2026. We did not report from a refinery or conduct on-scene interviews. First-person passages express editorial interpretation and household planning priorities. Numerical comparisons use the published units and dates; the shutdown decline is our arithmetic from the two federal snapshots.
The images show observed satellite conditions and dated energy-infrastructure maps. They do not document damage at individual refineries. We will distinguish new confirmed operational information from forecasts when updating this developing story.