
NEWS ANALYSIS / CLIMATE AND ENERGY
UN Climate Report Puts 1.5°C Overshoot in Focus Ahead of COP31
UNEP’s latest assessment separates a possible return to 1.5°C from the warming implied by today’s policies. Here is how to read the numbers—and what to watch at the next climate summit.
UNEP’s reported warming limit by 2100, with a 66% chance.
The corresponding estimate if countries implement all NDCs and sustain similar efforts.
The 2030 global emissions benchmark, relative to 2025—not an observed reduction.
The report changes the question around 1.5°C
The world has lost the opportunity to hold warming to 1.5°C above pre-industrial levels with no or only limited overshoot, according to the United Nations Environment Programme’s Emissions Gap Report 2026, released on October 21. The assessment now examines how to limit the size and duration of that overshoot and establish a route back.
That conclusion does not describe a single inevitable temperature outcome. The scale of future warming still depends on emissions, implementation of climate policies and other assumptions. A pathway showing what would be required is different from a projection of what existing policies are expected to deliver.
The findings arrive before COP31, scheduled for November 9–20 in Antalya, Türkiye. The report provides a scientific benchmark for those negotiations. It does not announce an agreement that governments have already reached.
THE REPORT IN ABOUT A MINUTE
Watch the numbers explained
Our original motion-graphics video compares policies, pledges and emissions benchmarks. Includes synthetic narration, burned-in captions and an optional English caption track.
Read the video transcript
The United Nations' new emissions gap report does not describe one fixed future. It compares what current policies deliver with what national pledges and a more demanding warming pathway would require.
Under current policies, the report gives a sixty-six percent chance of limiting warming to two point eight degrees Celsius by twenty-one hundred. Delivering all national climate pledges lowers that figure to two point six.
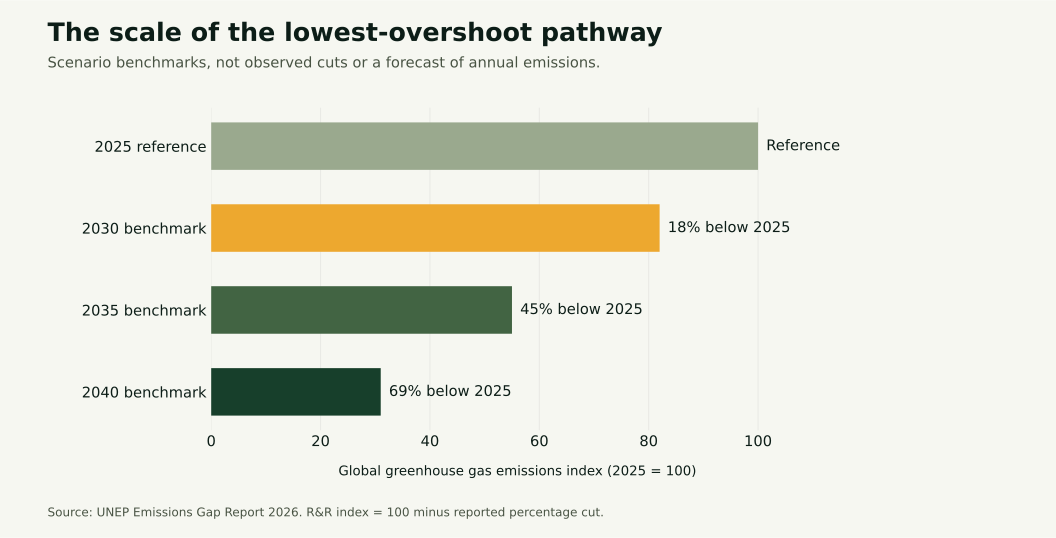
The lowest-overshoot pathway needs global emissions eighteen percent below twenty twenty-five levels by twenty thirty, forty-five percent below by twenty thirty-five, and sixty-nine percent below by twenty forty. These are scenario benchmarks, not recorded reductions.
Returning to one point five degrees by century's end is uncertain and also depends on carbon removal. At COP thirty-one, look for implementation, funding, and measurable delivery. For your own home, use local hazard information. A global average is not a neighborhood forecast.
Three comparisons that should stay separate
The headline temperatures answer a policy question. The reduction percentages answer a different question about the effort needed for a more demanding pathway. Mixing the two can make a conditional scenario sound like an expected result.
| Comparison | Reported result | Condition that matters |
|---|---|---|
| Current policies | 2.8°C by 2100 | Existing policies continue; warming continues beyond 2100. |
| Full implementation of national pledges | 2.6°C by 2100 | All NDCs are delivered and similar efforts continue. |
| Lowest-overshoot pathway | Peak around 1.7–1.8°C; possible return to 1.5°C by 2100 | Rapid cuts and large-scale carbon removal; return has roughly a 50% chance. |
The first two temperatures are UNEP’s 66%-chance warming-limit estimates, not certain outcomes or a full display of uncertainty. The overshoot pathway has different conditions and probabilities. Source: UNEP executive summary, sections 5–7.
What changed since the previous assessment?
UNEP says its current-policy estimate remains unchanged, while some pledge-based projections have worsened. It attributes those changes to the United States’ withdrawal from the Paris Agreement and revised estimates of historical emissions. This matters when reading claims that the entire outlook moved upward: the scenarios did not all change in the same way.
The comparison also does not rank the climate responsibility of individual households. It evaluates global outcomes under specified policy assumptions. Responsibility, financing and fairness remain political and distributional questions; a global temperature number cannot settle them by itself.
AN ORIGINAL VISUAL GUIDE
What the required cuts look like
Using an index makes the scale easier to compare without treating the values as measured future emissions.
View the numbers and calculation
| Year | Cut from 2025 | Remaining index |
|---|---|---|
| 2025 reference | 0% | 100 |
| 2030 benchmark | 18% | 82 |
| 2035 benchmark | 45% | 55 |
| 2040 benchmark | 69% | 31 |
For example, 100 − 45 = 55. The index is a visual conversion, not an additional model. It does not show an annual path between dates.
Download the chart data (CSV)Why a hot year and the Paris threshold are not identical
The World Meteorological Organization distinguishes annual temperatures from the Paris Agreement’s long-term warming level, typically considered over about 20 years. A single year above 1.5°C therefore answers a different question from whether long-term warming has exceeded that level.
The distinction is about the timescale of measurement, not a reason to dismiss hot years. When comparing two headlines, check whether each refers to a month, a year, a multi-year average or a modeled long-term outcome. Also check the reference period: the numbers in this article describe warming above pre-industrial conditions, not an increase from today.
Returning below a threshold would not rewind every impact
The IPCC’s synthesis findings warn that overshoot brings additional risks and adverse impacts, some irreversible, that grow with its magnitude and duration. This is why the date of a possible return and the peak reached along the way both matter.
UNEP also emphasizes the uncertainty of scaling up carbon dioxide removal. Cutting emissions reduces additions to the atmosphere; removal takes carbon dioxide out and stores it. A future removal assumption should not be read as a technology already operating at the required scale. The agency’s accompanying explainer discusses the technological and socioeconomic challenges.
R&R READING GUIDE
Four questions to ask of COP31 announcements
These are our editorial checks for interpreting new claims, not a prediction of the negotiating outcome.
What changes on the ground?
Look for the policy instrument, implementation date and organization responsible. An ambition statement and a funded program are different kinds of evidence.
Which baseline is being used?
A percentage without its year and scope is hard to compare. Check whether it concerns all greenhouse gases, carbon dioxide alone or one sector.
What is conditional?
Identify promises that depend on finance, technology support or another agreement. Keep those conditions attached when summarizing the claim.
How will delivery be checked?
Ask what published measure and reporting date will show progress. A later revision should be distinguishable from an achieved reduction.
Renewable growth and an emissions gap can coexist
Rapid deployment of cleaner generation does not automatically mean total emissions are declining fast enough. The International Energy Agency’s Electricity 2026 assessment describes growing electricity demand alongside expanding renewables and identifies grid connections, investment and system flexibility as important constraints.
That offers a useful way to assess a positive energy headline without dismissing it. New capacity is meaningful, but it is not the same measure as electricity generated, fossil generation displaced or emissions avoided. Ask which quantity the announcement reports before deciding whether it contradicts a global emissions assessment. Several trends can move in different directions at once.
WHAT THIS MEANS NEAR HOME
Use the global finding at the right scale
The report is not a flood warning for your street, a forecast of next month’s electricity bill or evidence that a particular storm was caused by one decision. Those questions need local hazard information, utility records or event-specific research.
For readers in the United States, keep the long-term climate picture separate from immediate instructions: local forecasts and warnings, building arrangements, access to cooling and an outage plan. Household preparation addresses exposure and disruption; it does not replace emissions policy.
Sources, scope and how this article was made
Published October 24, 2026, using primary material available on that date. This is independently written news analysis, without original interviews or attendance at the forthcoming summit. The charts, reading framework and video script are original. The hero is an AI-generated contextual illustration; it does not depict a documented facility or COP31. The video uses original animation and synthetic narration.
- UNEP: Emissions Gap Report 2026, published October 21.
- UNEP executive summary (PDF), especially sections 5–7 and Table ES.2.
- UNEP release on the required emissions reductions.
- UNEP explainer on overshoot and carbon removal.
- UNFCCC: COP31 dates and conference information.
- WMO: annual-to-decadal update (2025–2029), for the distinction between annual and long-term warming.
- IPCC synthesis headline findings, for overshoot risks.
- IEA: Electricity 2026 executive summary, for power-system context.
Editorial standards and corrections explain how to flag an error. Dates, policy assumptions and estimates may change after publication.