
NEWS EXPLAINER / ANTARCTICA AND COASTAL RISK
Thwaites Glacier’s Hidden Melt Zone Changes the Sea-Level Forecast
Warm seawater does not stop at a neat line beneath Antarctica’s most closely watched glacier. A new study shows why that matters—and why its numbers need careful reading.
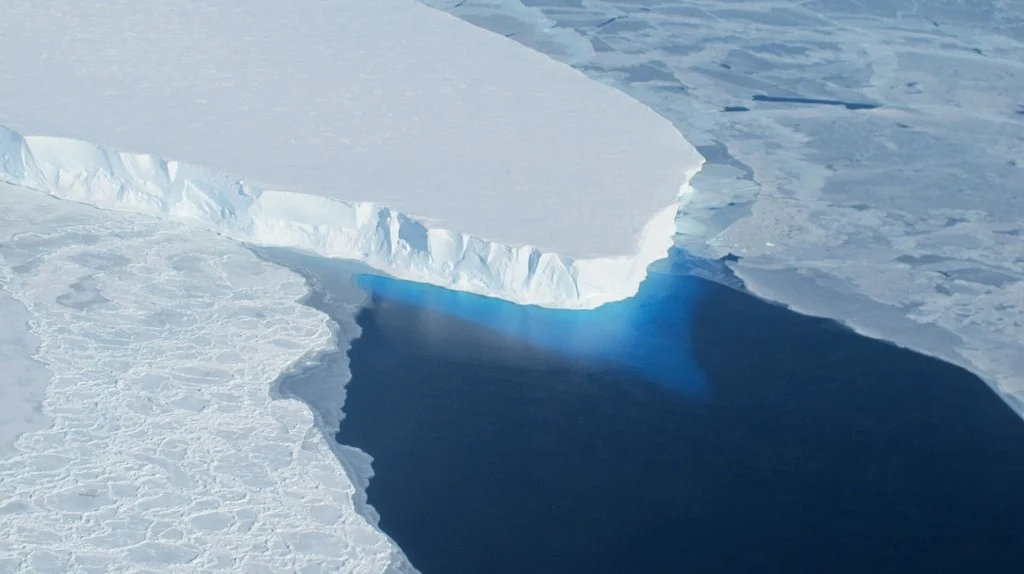
WATCH THE EXPLAINER
Thwaites: beneath the headline
A 70-second narrated video with NASA archive satellite imagery, original moving diagrams and a quiet original score.
Transcript and video credits
Thwaites Glacier is changing. But the latest research is not a countdown to instant collapse. The important discovery is where seawater can reach the ice.
Where grounded ice begins to float, tides can move seawater beneath a wider transition zone. Representing that process helps models reproduce the glacier’s observed retreat. This animation is a simplified explanation, not a measured cross section.
The study reports an upper contribution of about three centimetres, plus or minus six millimetres, by twenty one hundred, under its assumptions. That is from Thwaites alone. It is not total global sea level rise.
An early date in some simulations concerns detachment from a stabilizing ridge. It does not mean the whole glacier disappears that year. Your local flood exposure also depends on land movement, tides and regional ocean conditions.
Use official local flood information and alerts. Check access routes and shared building utilities. Read the full explanation and use the planning checklist in this article.
Archive imagery: NASA’s Worldview / Minnie Wong (SSAI), Journey of Iceberg B-22, released October 25, 2023. The satellite sequence is historical context, not footage of a 2026 event. Scientific diagrams, editing and music: Ready & Resourceful. Narration is synthetic. No NASA endorsement is implied.
NASA source and full creditsTHE SHORT ANSWER
A wider melt zone changes the calculation
Thwaites Glacier may add more to sea-level rise this century than some earlier models suggested because seawater reaches beneath an extended transition zone, rather than stopping neatly at a line. The October 12 study reports an upper projection of 30 ± 6 millimetres by 2100 under its model assumptions. That is a contribution from this glacier—not a forecast of total global sea-level rise, and not a date for its complete collapse. [1]
Not an infinitely thin boundary.
Thwaites alone; conditions and uncertainty matter.
No fixed date for the whole glacier to disappear.
What did the new Thwaites study actually change?
The difference begins at the bottom of the glacier, where ice resting on the seabed becomes ice floating on water. A tidy boundary makes the maths easier. A shifting band affected by tides is harder to represent—and potentially much more important.
Researchers led by Mattia Poinelli used the Ice-sheet and Sea-level System Model to examine retreat, thinning and acceleration from 1996 to 2023. Their successful reconstructions included actively melting grounding zones between two and five kilometres wide. Extending those simulations forward produced larger century-end contributions than earlier projections. [1]
NASA’s explanation highlights why this matters: allowing seawater into that transition improved the model’s agreement with historical satellite observations. Water can move under ice that a simpler model would treat as securely grounded. A better account of the boundary changes how the simulated glacier responds. [2]
The useful question is therefore more specific than “Is the glacier melting?” It is: are models representing the places where the ocean can reach the ice well enough? This paper identifies a consequential gap. It does not finish the job of forecasting Antarctica.
ORIGINAL VISUAL GUIDE / NOT TO SCALE
What is a grounding zone?
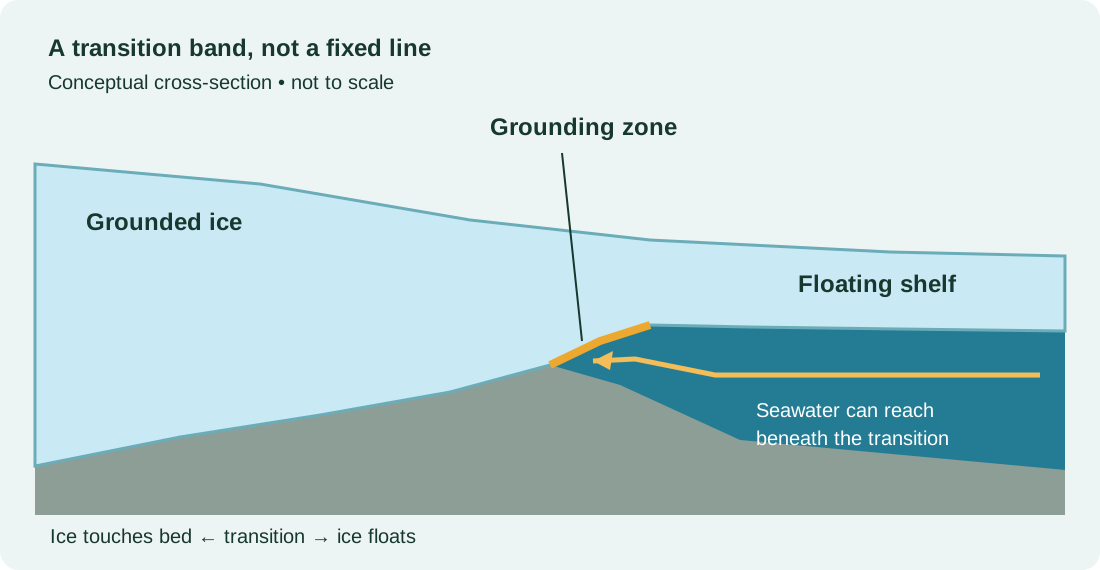
Ice touches the bed beneath it.
Tides and seawater affect the transition.
Ice is supported by the ocean.
Three numbers that should not be mixed together
The quickest way to misread this story is to strip a number away from its subject and timescale. Keep those attached. A century-end projection, an early simulated change at a ridge and the amount of ice in a whole glacier answer different questions.
| Number | What it refers to | What it does not establish |
|---|---|---|
| 30 ± 6 mm | The study’s reported upper contribution to global mean sea level by 2100, without additional climate warming in that experiment. [1] | Total sea-level rise from every source, or a guaranteed increase at your address. |
| As early as 2038 | Modelled detachment from a stabilizing seabed ridge in some simulations. [1] | A prediction that the entire glacier disappears in 2038. |
| About 65 cm | The sea-level equivalent of complete Thwaites loss described by the International Thwaites Glacier Collaboration. [3] | The result forecast by this study for 2100. |
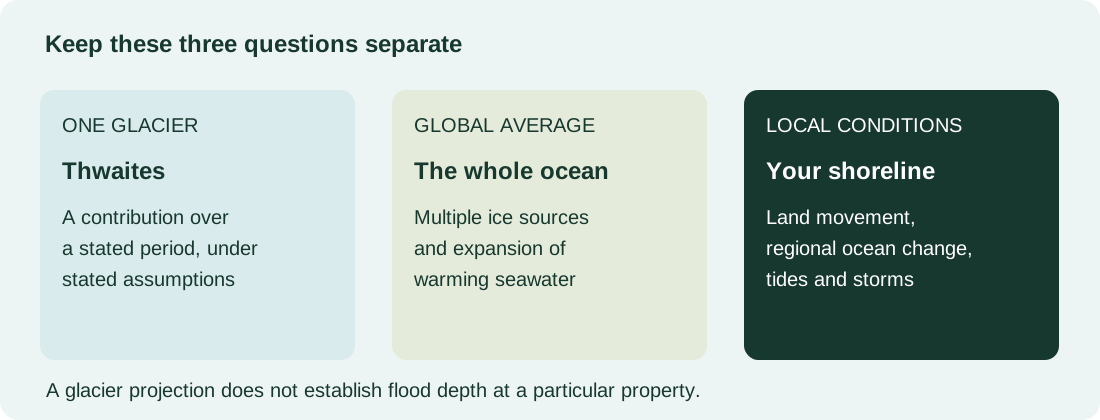
Thirty millimetres is three centimetres, or approximately 1.2 inches. That conversion makes the unit familiar; it does not tell a homeowner the eventual flood depth in a hallway. Likewise, the glacier’s full ice inventory is a measure of scale, not a stopwatch.
“Double” also needs a denominator. NASA describes contributions reaching roughly twice some previous estimates in particular simulations. It is not a claim that all sea-level rise has suddenly doubled, or that every future assessment should be multiplied by two. [2]
ORIGINAL NUMBER GUIDE
One glacier’s contribution is part of a larger picture
Why a better model still carries uncertainty
A model can be useful without being a photograph of the future. Matching past observations is an important check: it asks whether the simulated glacier behaves plausibly under conditions for which there is evidence. That is different from knowing the ocean, atmosphere and ice geometry decades ahead.
Read the result in three layers. First, identify the observations used to test the model. Second, ask which physical processes were added or simplified. Third, keep the future conditions beside the output. Losing any one of those layers can turn a conditional scientific finding into a misleading prediction.
Our interpretation: this is a reason to improve coastal planning and scientific modelling, not to announce a universal evacuation deadline. The paper does not provide property-level flood forecasts.
Is the separate “150 years” headline the same study?
No. An October 13 British Antarctic Survey release describes a different experiment that switched off ocean melting in three models for 150-year simulations. Thwaites continued shrinking in those experiments, while Pine Island behaved differently. That investigation asks about persistence after an extreme change in ocean forcing. It should not be merged with the October 12 grounding-zone paper as if the two produced one shared forecast. [8]
Does “without additional warming” mean emissions no longer matter?
No. Holding a driver steady in an experiment isolates a question; it does not establish that other drivers are harmless. BAS explicitly says current warm oceans and future emissions can worsen the remaining ice loss. Planning for changes already underway and limiting further warming are compatible tasks. [8]
What does an Antarctic glacier mean for your coast?
Think of global mean sea level as an overall indicator, not a local tide-gauge reading. NASA explains that land movement, ocean circulation and the redistribution of water associated with ice loss can make local change different from the global average. Sinking land can worsen the change measured relative to a street or shoreline. [5]
Higher background water levels can also make ordinary tides more disruptive. NOAA describes high-tide flooding as the result of rising relative sea level combining with factors such as winds, currents and strong tides. It can occur without a hurricane overhead. [6]
For an individual household, that changes the practical questions. Can the access road flood before the building does? Does the ground-floor electrical room serve upper floors? Where does the lift stop working during a power interruption? Those are prompts for a building manager or local authority—not facts that a glacier paper can answer.
Our storm surge versus flooding explainer separates coastal and inland mechanisms. If water has already entered a flat, use the apartment flood documentation guide rather than treating this long-term research as incident instructions.
TURN THE HEADLINE INTO A USEFUL CHECK
A coastal planning check you can do now
This checklist is an editorial planning aid. It does not assess a property, replace an official warning or recommend a purchase. Tick completed steps on this page, then print a copy if useful. Entries are not saved.
0 of 6 planning checks complete
For U.S. readers
Start with NOAA’s Sea Level Rise Viewer. Compare local scenarios and mapping confidence; use local emergency-management services for current warnings. A national visualization is not a parcel survey. [7]
For readers in England
The official long-term flood-risk service covers several flood sources and links to the separate services for Scotland, Wales and Northern Ireland. It explicitly does not predict an individual property’s likelihood of flooding. [9]
Questions the headline leaves behind
Is Thwaites going to collapse suddenly?
The October paper should not be presented as a dated, all-at-once collapse forecast. Its early ridge-detachment result concerns a particular process in simulations. Keep a claim about a ridge separate from a claim about a whole glacier.
Why call it the “Doomsday Glacier”?
The nickname signals the glacier’s large potential consequences. It is not a scientific timescale, a probability or an official alert level. “Thwaites Glacier” is the more useful term when looking up the research and comparing findings.
Should inland readers ignore the story?
Inland readers may have coastal relatives, travel routes or work connections, but their immediate household priorities should follow local hazards. Do not use an Antarctic headline to diagnose a basement leak or assume every water problem is connected to the sea.
What would make the next update useful?
Look for new observations, an explanation of the model assumptions, a clearly stated comparison and a timescale. Be cautious when a headline gives only a dramatic nickname and a large number. The most useful update tells you what changed in the evidence.
Sources and how we reported this
This is an independently researched news explainer, published October 24, 2026. We used the study’s published abstract and institutional explanations, alongside coastal guidance. We did not interview the researchers or independently run their model. CNN’s linked page was inaccessible during preparation; no CNN text, images or video were reused. Our schematics and household planning prompts are original editorial additions.
- Poinelli and colleagues, Nature Communications, October 12, 2026. DOI: 10.1038/s41467-026-77976-1. Study abstract; numerical projections and grounding-zone scope.
- NASA JPL, October 20: study explanation. Model process and comparison with historical observations.
- International Thwaites Glacier Collaboration, September 2025 findings. Glacier context and full-loss sea-level equivalent.
- NASA: why global sea level rises.
- NASA: local sea-level change.
- NOAA: high-tide flooding.
- NOAA Sea Level Rise Viewer.
- British Antarctic Survey, October 13: separate ocean-cooling experiment. Institutional release available in search results; direct page access was blocked.
- GOV.UK: long-term flood risk in England.
Image credit: NASA/OIB/Jeremy Harbeck, 2014, via NASA JPL. Used for factual reporting under NASA media guidelines; no NASA endorsement is implied. Original diagrams: Ready & Resourceful. No affiliate products have been added to this article.